
Restaurant Break-Even Analysis: How to Calculate Your True Survival Point
Restaurant break-even analysis defines the revenue level required to cover all operating costs before profit begins. This financial threshold applies to any restaurant concept — independent, franchise, fine dining, or quick service — because it is driven by cost structure, not cuisine.
1. What Restaurant Break-Even Analysis Actually Means
Break-even occurs when total revenue equals total operating costs.
- All variable costs are covered
- All fixed costs are covered
- Operating profit equals zero
Break-even defines survival. Profit only begins after this point.
Understanding restaurant break-even analysis allows operators to measure financial stability before focusing on growth.
Many restaurant owners understand break-even calculations but struggle to apply them within a complete profitability framework. Working with a restaurant consultant in Vancouver BC can help connect break-even analysis, menu engineering, labor management, and cost control into a unified financial strategy.
2. Contribution Margin Explained
Contribution margin is the amount remaining from each sale after variable costs are deducted.
Formula:
Contribution Margin (Unit) = Selling Price − Variable Cost Contribution Margin Ratio = Contribution Margin ÷ Selling Price
Example (Per Guest)
| Item | Amount |
|---|---|
| Average Guest Check | $42 |
| Variable Cost | $25 |
| Contribution Margin | $17 (40%) |
This 40% contributes toward fixed costs and eventual profit.
3. Weighted Contribution Margin and Menu Mix
Restaurants rarely sell a single product. Different menu items carry different margins.
| Item | Selling Price | Variable Cost | Margin |
|---|---|---|---|
| Burger | $18 | $9 | 50% |
| Pasta | $24 | $15 | 37% |
If sales mix shifts toward lower-margin items, the required revenue threshold increases.
4. Restaurant Break-Even Revenue Formula
Break-Even Revenue = Fixed Costs ÷ Contribution Margin Ratio
| Metric | Value |
|---|---|
| Fixed Costs | $15,000 |
| Contribution Margin | 40% |
| Break-Even Revenue | $37,500 |
5. Break-Even by Date (Profit Window)
| Daily Revenue | Break-Even Day |
|---|---|
| $2,000/day | Day 19 |
| $1,500/day | Day 25 |
The earlier break-even is reached, the larger the monthly profit window.
6. Sensitivity Analysis
If fixed costs increase by $2,000:
17,000 ÷ 0.40 = $42,500 required revenue.
Small structural shifts significantly increase survival pressure.
7. Semi-Variable Costs Clarification
Some costs are semi-variable (utilities, credit card fees, maintenance). Accurate modeling improves precision.
8. Restaurant Break-Even vs Cash Flow and Taxes
This calculation is performed before corporate income tax.
If operating profit equals zero, corporate tax equals zero.
Break-even does not automatically mean positive cash flow. Inventory buildup, debt payments, and capital expenditures affect liquidity.
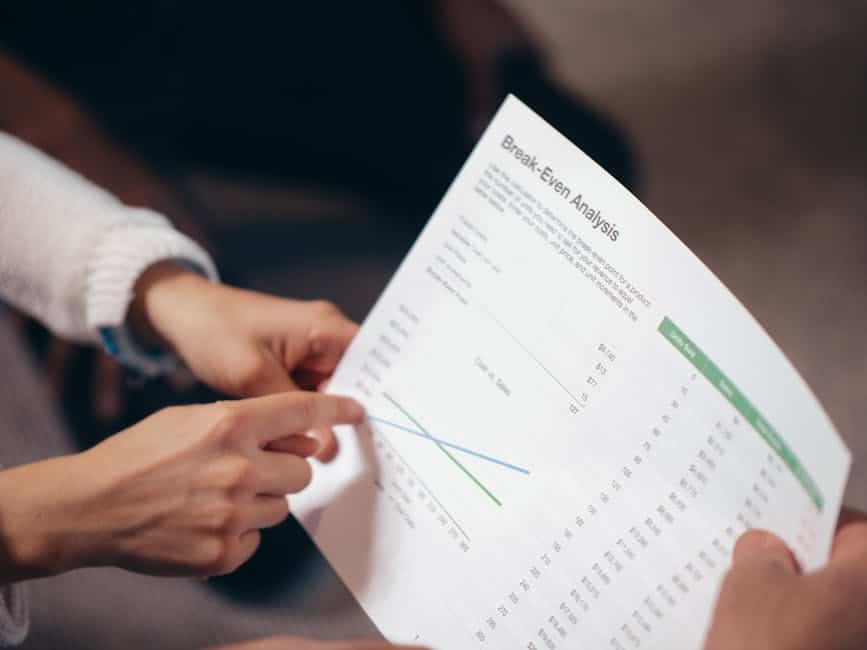
9. Visual Model
10. What To Do After Calculating Break-Even
- Improve prime cost control
- Optimize menu mix
- Adjust pricing strategically
- Negotiate fixed costs
- Increase average check
Understand how this fits inside broader restaurant business planning.
Structured Financial Education Pathway
If you prefer building internal financial capability instead of outsourcing implementation, structured education may be the right step.
This modeling approach aligns with managerial accounting standards referenced by the AICPA .
The Restaurant Business Planning Online Course inside Online Culinary School walks through:
- Cost structure design
- Break-even modeling
- Operating budget construction
- Profit forecasting
- Capital planning
Explore the full program from our Online Culinary School e-learning platform here:
Restaurant Business Planning Online Course (OCS)
Direct Implementation Support
If you prefer direct implementation and financial structure review, a restaurant consultant in Vancouver BC can help build your break-even model, analyze cost structures, identify profitability opportunities, and create a realistic financial roadmap.